Completely Randomized Design Analysis: Theory, Example and Demonstration in Agri Analyze tool
The Blog is about CRD analysis theory, example and analysis using Agri Analyze tool
Link of the MCQ for CRD design is shared in bottom
Introduction
Experimental
design in agriculture is a systematic approach to planning and conducting field
experiments. It involves designing the layout of experimental plots, allocating
treatments and randomizing treatments to minimize bias. Common designs include
Completely Randomized Design (CRD), Randomized Complete Block Design (RCBD), Factorial
design, Split-plot design, and Latin square design. These designs help evaluate
the effects of different factors on crops, soils, pests and other agricultural
outcomes. By providing reliable and reproducible results, experimental design
guides farmers and policymakers in making informed decisions to improve
agricultural practices.
1.
What is Completely
Randomized Design (CRD)?
Complete Randomized Design (CRD) is
a basic and widely used experimental design in agriculture and other fields. In
CRD, experimental units (plots, animals, etc.) are randomly assigned to
different treatment groups. Each treatment is applied to a separate group of
units and all treatments have an equal chance of being assigned to any unit.
This design allows researchers to compare the effects of treatments without the
influence of any other variable, making it useful for studying the effects of a
single factor on a response variable.
The CRD is the simplest experimental
design, based on randomization and replication principles. It's suitable for
homogeneous experimental units. Treatments are randomly allocated across the
entire experimental area without blocking. In field experiments, the field is
divided into equal-sized plots, and treatments are randomly assigned to these
plots. This design enables direct treatment comparison, making it valuable for
studying single-factor effects on outcomes.
2.
When CRD is used?
The
Complete Randomized Design (CRD) is primarily suitable for greenhouse,
methodological, and laboratory studies where the experimental material is
homogeneous. However, its use in field experiments is limited. CRD is most
effective when the variation across the entire experimental unit is relatively
small. In field settings where environmental variability or other factors can
significantly impact results, other designs like Randomized Complete Block
Design (RCBD) or Split-Plot Design are often preferred for their ability to
account for and minimize such variation.
3.
How CRD is different from
RCBD?
Complete
Randomized Design (CRD) and Randomized Complete Block Design (RCBD) are two
common experimental designs used in agricultural research. The main differences
between the two lies in their approach to handling variability and potential
sources of bias:
1. Blocking:
In CRD, there is no blocking. Treatments
are assigned at random to experimental units without any consideration for
grouping or blocking. In contrast, RCBD involves grouping experimental units
into blocks based on similarities (e.g., soil type, field topography)
and then randomizing treatments within each block. This helps account for
variability within blocks and increases the precision of treatment comparisons.
2. Precision
and Control: RCBD generally provides more precise
estimates of treatment effects compared to CRD. This is because blocking
reduces the variability within blocks, making treatment comparisons more
sensitive to real differences.
3. Accounting
for Variability: CRD assumes that all variability in
the experiment is due to random factors. In RCBD, variability is partitioned
into two sources: variation within blocks (which is assumed to be random) and
variation between blocks (which is used to estimate the treatment effects).
4. Efficiency:
RCBD is more efficient than CRD when there is considerable variability in the
experimental area or when there are known sources of variability that can be
controlled by blocking.
Overall, while CRD is simpler to implement and analyze, RCBD is preferred in field experiments where there is variability that can be accounted for by blocking, leading to more reliable and precise results.
4.
ANOVA model for CRD
In
a CRD, the Analysis of Variance (ANOVA) model is used to analyze the data and
test the significance of treatment effects. The ANOVA model for CRD can be
expressed as follows:
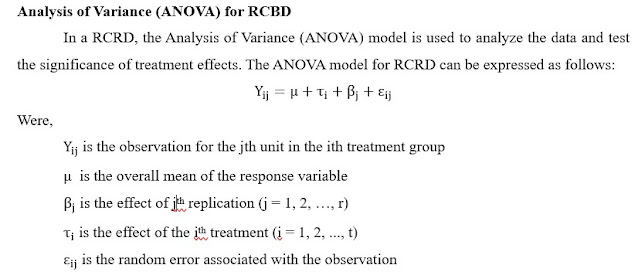
Y ij = m + t i + e j
Where,
Y i is the
observation for the jth unit in the ith treatment group
m is the
overall mean of the response variable
t i is the
effect of the ith treatment (i = 1, 2, ..., t)
e j is the
random error associated with the observation
4.
Randomization steps in CRD
In
a Complete Randomized Design (CRD), randomization of treatments is a crucial
step to ensure the validity and reliability of the experiment. The steps for
randomizing treatments in a CRD are as follows:
1. Assign
Numbers to Treatments: Assign a unique number
to each treatment. For example, if there are 4 treatments, label them as 1, 2,
3, and 4.
2. Random
Number Generation: Use a random number
generator (e.g., computer software, random number table) to generate a random
sequence of numbers corresponding to the treatments. This random sequence will
determine the order in which treatments are assigned to experimental units.
3. Assign
Treatments: Assign treatments to experimental
units according to the random sequence generated. Treatments should be assigned
sequentially in the order given by the random sequence.
4. Ensure
Balance: Ensure that each treatment is assigned an
equal number of times and that each experimental unit receives only one
treatment.
5. Record
and Implement: Record the randomization process and
implement it in the actual experiment. This helps maintain the integrity of the
randomization and ensures that the experiment is conducted as planned.
By
following these steps, the randomization of treatments in a CRD helps minimize
bias and ensures that any observed differences among treatments are due to the
treatments themselves and not to the way they were assigned.
5.
Analysis steps for CRD
1.
Calculate Means: Calculate the mean of each treatment group, as well as the overall
mean of all observations.
2.
Calculate Sum of Squares: Calculate the total sum of squares (SST), sum of squares due to
treatments (SST) and sum of squares due to error (SSE).
3.
Calculate Degrees of Freedom: Determine the degrees of freedom for treatments
and error.
4.
Calculate Mean Squares: Calculate the mean squares for treatments (MST) and error (MSE) by
dividing the sum of squares by their respective degrees of freedom.
5.
Calculate F-Statistic: Calculate the F-statistic by dividing MST by MSE.
6.
Determine Significance: Use the F-statistic to determine the significance of the treatment
effects. Compare the calculated F-value to the critical F-value from the
F-distribution table at a chosen significance level (e.g., 0.05). If the
calculated F-value is greater than the critical F-value, reject the null
hypothesis and conclude that there are significant differences among the
treatment means.
7.
Perform Post-hoc Tests (if needed): If the F-test indicates significant differences
among treatment means, perform post-hoc tests (e.g., Tukey's HSD, LSD) to
determine which specific treatments differ from each other.
8.
Interpret Results: Interpret the results of the analysis, including the significance of
treatment effects and any pairwise differences between treatments.
9.
Report Findings: Present the results of the analysis in a clear and concise manner,
including tables or graphs to display the data and statistical findings.
By
following these steps, researchers can effectively analyze data from a CRD and
draw valid conclusions about the effects of treatments on the response
variable.
4.
ANOVA outline for CRD
Here's a brief outline of the ANOVA procedure for a
Complete Randomized Design (CRD):
4.
Example of CRD
Consider the following data on gains
in weight (kg/6 weeks) due to A, B, C, D and E, the five different feeds fed to
twenty Kankrej heifers, four animals in each group.
|
A |
B |
C |
D |
E |
|
20.0 |
21.5 |
12.8 |
16.5 |
17.2 |
|
18.5 |
22.2 |
14.2 |
14.8 |
17.9 |
|
18.2 |
24.6 |
15.0 |
17.6 |
21.3 |
|
20.3 |
23.7 |
16.0 |
18.1 |
20.6 |
Solution:
In order to check this null
hypothesis, we are required to compare the Calculate F value (18.259) with
Table F value (3.05). As the Calculated F value is greater than Table F value
our results are significant at 5 % level of significance. Further we can test
for 1 % level by comparing Calculate F value (18.259) with Table F value
(4.89), so result is also significant at 1 % level of significance, and we
reject our null hypothesis.
This mean that mean performance of
all the treatment is not same. This raises the question that which treatment
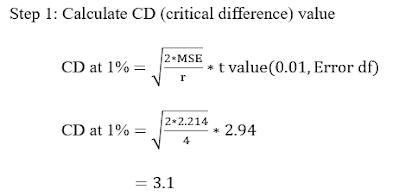
gives a better Feed. In order to get this answer, we need to perform LSD test.
LSD TEST (FOR MEAN COMPARISON):
Step 2: Calculate the treatment means and arrange
them in ascending order
The treatment mean is obtained by dividing
treatment total with number of replications
|
B |
A |
E |
D |
C |
|
23.00 |
19.25 |
19.25 |
16.75 |
14.50 |
Conclusion
The ANOVA results reveal that the
treatment component is significant at 1 % level of significance. The LSD test
reveals that highest yield was observed for treatment B and none of the
treatments was at par with it.
Feeds A and E are not significantly
different from each other. While feeds B, C and D significantly differed from
each other and with feeds A and E also. Feed B is the best feed among the
five-feed tried.
Steps to perform analysis of CRD in Agri Analyze
Step 1: To create a CSV file with columns for Treatment and
Yield (Gain).
Step 2: Go with Agri Analyze site. https://agrianalyze.com/
Step 3: Click on
ANALYTICAL TOOL
Step 4: Click on DESIGN
OF EXPERIMENT
Step 5: Click on CRD
ANALYSIS
Step 6: Click on ONE
FACTOR CRD ANALYSIS
Step 7: Select CSV file.
Step 8: Select treatment
and dependent variable (e.g., Gain).
Step 9: Select a test for multiple comparisons, such as the Least Significant Difference (LSD) test, to determine significant differences among groups. Same as for Duncan’s New Multiple Range Test (DNMRT), Tukey’s HSD Test.
Step 10: After submit download analysis report.
REFERENCES
Gomez, K. A., & Gomez, A. A. (1984). Statistical Procedures for Agricultural Research. John wiley & sons. 8-13.
This post is written by:
Darshan Kothiya
Content Writer
Agri Analyze
Other links:
Randomized Complete Block Design
Split plot design


Comments