Posts

Showing posts from July, 2020

RCBD analysis in R along with LSD and DNMRT test

Image
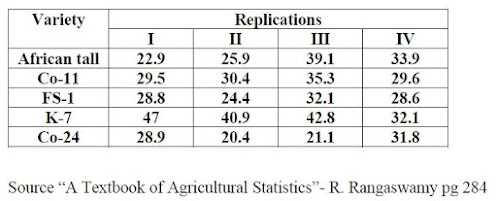
The blog explains step by step RCBD analysis along with LSD/DNMRT test using R and interpretation of analysis (Reading time 12 min.) Problem statement An experiment was conducted in RCBD to study the comparative performance of fodder sorghum lines under rain fed conditions. Data is furnished below. Are all lines same? If not carry out LSD test and Duncan test to compare the lines. Click here to get the data Arrange the data in Excel as shown below Replication Variety Yield 1 African tall 22.9 1 Co-11 29.5 1 FS-1 28.8 1 K-7 47 1 Co-24 28.9 2 African tall 25.9 2 Co-11 30.4 2 FS-1 24.4 2 K-7 40.9 2 Co-24 20.4 3 African tall 39.1 3 Co-11 35.3 3 FS-1 32.1 3 K-7 42.8 3 Co-24 21.1 4 African tall 33.9 4 Co-11 29.6 4 FS-1 28.6 4 K-7 3

Completely Randomized Design Analysis in R along with LSD

Image
(Reading time 6 min.) Click here for Data set R-script #Fitting of linear model model <-lm(CRD$Yield ~ CRD$Treatment) #Obtains R Square and other statistics of fitted model summary <-summary(model) #Carryout ANOVA anova <-anova(model) anova #Below codes are used to obtain plots of fitted vs Residuals and Normal QQ plots par(mfrow=c(1,2)) plot(model, which=1) plot(model, which=2) #Load the package library(agricolae) #Carry out LSD test LSD <-LSD.test(CRD$Yield,CRD$Treatment,anova$`Df`[2],anova$`Mean Sq`[2]) #Generate the txt file of analysis sink("crdanalysis.txt") print("ANOVA of CRD") print(anova) print("LSD ANALYSIS") print(LSD$statistics) print(LSD$groups) sink() Output  [1] "ANOVA of CRD" Analysis of Variance Table Response: CRD$Yield                             Df            Sum Sq     Mean Sq         F value    Pr(>F)    CRD$Treatment  1               220.90   

Split plot analysis in R using doebioresearch package

Image
The blog explains split plot analysis in R along with assumption testing and LSD test for mean comparison (Reading time 9 min) Click on the image to expand Replication: 4 Main-plot: Variety levels 3 Sub-plot: Nitrogen levels 3 Dependent variable: Yield  Source of problem: https://fliphtml5.com/waov/gjll/basic  Data: excel sheet  R-script: script #Upload excel file into RStudio library(readxl) SP <- read_excel("D:/Youtube/Design of Experiments/Split plot/SP.xlsx") View(SP) #You can upload the data by clicking on import data set-> From Excel -> Browse -> Select your file-> #Import #Load doebioresearch package library(doebioresearch) #Store split plot analysis in variable named output along with LSD test output<-splitplot(SP[4],SP$Replication,SP$Variety,SP$Nitrogen,1) #Store output in document outside RStudio in word file sink("output.doc") print(output) sink() Output from R: Analysis of Variance Ta