Posts

Showing posts from December, 2020

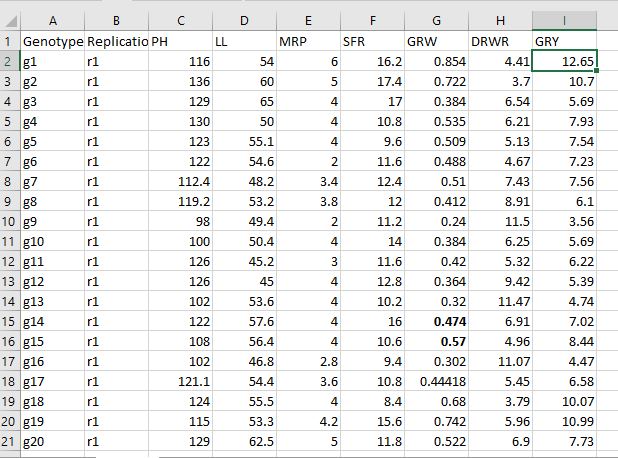
Varibility analysis in R - III: Genotypic path analysis

     The blog is third and last part of a series of three blogs related to variability analysis using R software. The blog demonstrates use of variability package available in R for carrying out genotpyic path analysis among traits in one line of code. (Reading time 9 min.)      Before heading further to read this blog it is highly recommended to go through first blog Variability analysis in R - I: Genetic parameters .Reading the first blog will give an idea about how to arrange the data in excel sheet, import the data in RStudio and install the package named variability required for the analysis.      For path analysis we need have one dependent variable (trait) and other as independent variables. We generally choose yield or yield attributing trait as a dependent variable. In our case we will use GRY as a dependent variable. Make sure the dependent variable is kept in last column of data set. R Script for Genotypic correlation Lines in blue are script. Type these blue lines and

Varibility analysis in R - II: Genotypic and Phenotypic correlation

 The blog is second part of a series of three blogs related to variability analysis using R software. The blog demonstrates utilization of variability package available in R for calculating genotypic and phenotypic correlation among traits in one line of code. (Reading time 7 min.) Before heading further to read this blog it is highly recommended to go through first blog Variability analysis in R - I: Genetic parameters .Reading the first blog will give an idea about how to arrange the data in excel sheet, import the data in RStudio and install the package named variability required for the analysis. R Script for Genotypic correlation  Lines in blue are script. Type these blue lines and press Ctrl+Enter run the lines. Open a new script by clicking on New and than selecting R script or by pressing Ctrl+Shift+N.   In our first blog we have seen that SFR trait had shown negative genotypic variance & we need to drop that trait from data set. In order to do that there are two ways: In

Variability analysis in R - I: Genetic parameters

Image
The blog is first part of a series of three blogs related to variability analysis using R software. The blog demonstrates utilization of variability package available in R for getting genetic parameters like genotypic and phenotypic variance, coefficient of variation, heritability (broad sense), genetic advance & genetic advance as a percentage of mean for more than one traits in one line of code. (Reading time 14 min.)   Step-I Arrangement of data in Excel file   The data consist of 28 genotypes, 2 replication and 7 traits. First arrange genotypes followed by replication and than seven traits. The file is named vardata . You can download the excel file . Have a look at snip of data. Step-II Import the excel data file in RStudio On the upper right quadrant in RStudio there is tab of import dataset. Click on it and choose From Excel option. Browse for the excel file and click on import. After successful import one can see the dataset in Global Environment by the name vardata   Step