RCBD analysis in R along with LSD and DNMRT test
The blog explains step by step RCBD analysis along with LSD/DNMRT test using R and interpretation of analysis (Reading time 12 min.)
Problem statement
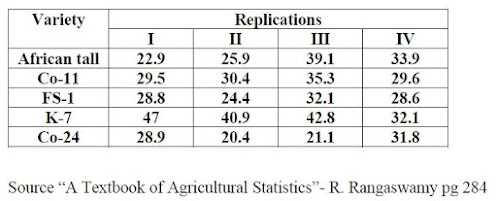
An experiment was conducted in RCBD to study the comparative performance of fodder sorghum lines under rain fed conditions. Data is furnished below. Are all lines same? If not carry out LSD test and Duncan test to compare the lines.
Arrange the data in Excel as shown below
| Replication | Variety | Yield |
| 1 | African tall | 22.9 |
| 1 | Co-11 | 29.5 |
| 1 | FS-1 | 28.8 |
| 1 | K-7 | 47 |
| 1 | Co-24 | 28.9 |
| 2 | African tall | 25.9 |
| 2 | Co-11 | 30.4 |
| 2 | FS-1 | 24.4 |
| 2 | K-7 | 40.9 |
| 2 | Co-24 | 20.4 |
| 3 | African tall | 39.1 |
| 3 | Co-11 | 35.3 |
| 3 | FS-1 | 32.1 |
| 3 | K-7 | 42.8 |
| 3 | Co-24 | 21.1 |
| 4 | African tall | 33.9 |
| 4 | Co-11 | 29.6 |
| 4 | FS-1 | 28.6 |
| 4 | K-7 | 32.1 |
| 4 | Co-24 | 31.8 |
R Script
#Ho:African tall=Co-11=FS-1=K-7=Co-24, Ha: Atleast one variety is different
#Fitting of linear model
model <-lm(RBD$Yield~ RBD$Replication+RBD$Variety)
#Obtain ANOVA
anova <-anova(model)
anova
#Fitting of linear model
model <-lm(RBD$Yield~ RBD$Replication+RBD$Variety)
#Obtain ANOVA
anova <-anova(model)
anova
#Below codes are used to obtain plots of fitted vs Residuals and Normal QQ plots
par(mfrow=c(1,2))
plot(model, which=1)
plot(model, which=2)
par(mfrow=c(1,2))
plot(model, which=1)
plot(model, which=2)
#Load the agricolae package
library("agricolae")
#Duncan test
DNMRT <-duncan.test(RBD$Yield,RBD$Variety,12,29.259)
DNMRT
DNMRT <-duncan.test(RBD$Yield,RBD$Variety,12,29.259)
DNMRT
#LSD test
LSD <-LSD.test(RBD$Yield,RBD$Variety,12,29.259)
LSD
LSD <-LSD.test(RBD$Yield,RBD$Variety,12,29.259)
LSD
#Save the file in txt
sink("RBD.txt")
print(anova)
print("DNMRT Result")
print(DNMRT$statistics)
print(DNMRT$groups)
print("LSD Result")
print(LSD$statistics)
print(LSD$groups)
sink()
sink("RBD.txt")
print(anova)
print("DNMRT Result")
print(DNMRT$statistics)
print(DNMRT$groups)
print("LSD Result")
print(LSD$statistics)
print(LSD$groups)
sink()
Output from R
Analysis of Variance Table
Response: RBD$Yield
Df Sum Sq Mean Sq F value Pr(>F)
RBD$Replication 3 80.80 26.934 0.9205 0.46033
RBD$Variety 4 520.53 130.133 4.4476 0.01958 *
Residuals 12 351.11 29.259
Response: RBD$Yield
Df Sum Sq Mean Sq F value Pr(>F)
RBD$Replication 3 80.80 26.934 0.9205 0.46033
RBD$Variety 4 520.53 130.133 4.4476 0.01958 *
Residuals 12 351.11 29.259
[1] "DNMRT Result"
MSerror Df Mean CV
29.259 12 31.275 17.29547
RBD$Yield groups
K-7 40.700 a
Co-11 31.200 b
African tall 30.450 b
FS-1 28.475 b
Co-24 25.550 b
MSerror Df Mean CV
29.259 12 31.275 17.29547
RBD$Yield groups
K-7 40.700 a
Co-11 31.200 b
African tall 30.450 b
FS-1 28.475 b
Co-24 25.550 b
[1] "LSD Result"
MSerror Df Mean CV t.value LSD
29.259 12 31.275 17.29547 2.178813 8.333639
RBD$Yield groups
K-7 40.700 a
Co-11 31.200 b
African tall 30.450 b
FS-1 28.475 b
Co-24 25.550 b
MSerror Df Mean CV t.value LSD
29.259 12 31.275 17.29547 2.178813 8.333639
RBD$Yield groups
K-7 40.700 a
Co-11 31.200 b
African tall 30.450 b
FS-1 28.475 b
Co-24 25.550 b
Interpretation of the result
From ANOVA: The replication was non-significant so the mean yield for all the four replications is same. The treatment was significant i.e. yield of at least on variety is different from the rest. As treatment is significant we should switch to multiple mean comparison test like LSD or DNMRT test.
From LSD test: The variety K-7 gives highest yield with is significantly different from the rest of the varieties. The performance of variety Co-11 was statistically at par with African tall, FS-1 and Co-24.
From Dunccan/DNMRT test: Same as the LSD test as both shows same set of sequence of letters.
From plots: The assumptions of ANOVA are not violated.
Love seeing videos instead of reading! Tune to the video
If you are using "agricolae" package for analysis. You can cite it as:
Mendiburu, Felipe. (2010). Agricolae: Statistical Procedures for Agricultural Research. R package version. 1. 1-8.
To learn more about Agricultural Statistics follow my YouTube channel
Topics you might be interested in:
Completely Randomized Design Analysis in R along with LSD
Principles of designs of experiments-I: Replication


Comments
1) Install agricolae package
2) Load the package
3) Run this ?HSD.test
For above example you can use it as
HSD.test(RBD$Yield,RBD$Variety,12,29.259)
Hope you find it useful
Regards
RAAJ
U.K from Makerere University